Your unit may already have data packaged into easily understandable dashboards, reports, or alerts, but sometimes you will need specific information. Splunk's power is its searching capabilities. Since logs do not follow the same structure, Splunk breaks down the data into fields or parameters, such as host, time, process, action, etc. You will easily be able to compare different logs, correlate information, and make conclusions.
Learning the Splunk language will take practice, but following the Recommendations there is a process you can follow:
- Identify your goal.
- Narrow the timeframe.
- Pick out the needed data.
- Investigate the data to identify other values that will assist in achieving the goal.
- Make the data easy to draw conclusions using naming, statistical analysis, and visuals.
Time Range
Filtering search criteria using a time range is the most effective way to optimize your search. If you know the approximate timeframe when the issue occurred, you can investigate an incident. The time range picker is located to the right of your search.
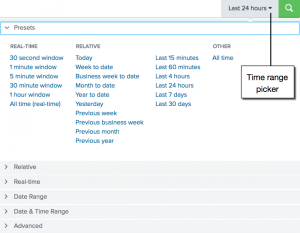
- Presets: Common search times created by Splunk.
- Relative: Specify after a number of days, rather than a date.
- Date Range: Customize range between dates, before a date, or after a date.
- Date & Time Range: Customize time and range between dates, before a date, or after a date.
- Advanced: Specify the earliest and latest times, as UNIX time or relative time notation.
Searching
The basis of Splunk searching is its default fields. A brief explanation of the default fields can be found below. However, more details and examples can be found in the Glossary.
- Index: Based on common groups of data or units.
- Source: Directory, file name, or file path.
- Sourcetype: Classification of the monitored data such as service or software.
- Host: Machine the event came from.
Searching Notation
Starting off with the first part of the search, you can write commands to filter, enrich, or modify data. Each command has the following syntax:
<first part of search> | <command_name> <command_parameters> | <next_command> <next_command_parameters ...
The vertical bar between commands are called “pipes” because it marks the boundary between the previous command and the current command, where the input of the previous command is piped into the current command and the current command pipes its output into the next command. In other words, all data from your search flow through Splunk commands like a stream, and each command can add to, remove from, or modify the data that flows through it.
Subsearches and long complex searches can be difficult to read. To make the search easier to read, we encourage subcommands (commands leading with pipe), start on a new line.
The Search bar contains features to help you read, parse, or interpret the Splunk language syntax. The syntax highlighting feature displays parts of the language in different colors:
- Commands will show in blue. For example, "tstats," "eval."
- Command arguments will show in green. For example, "span," "usenull."
- Functions will show in pink. For example, "count," "round," "avg."
- Keyword modifiers and Boolean operators will show in orange. For example, "not," "or," "and," "as," "by."
- Inline comments will show in gray. For example, quotations.
Commands
This is a list of commonly used commands. If you're looking for commands not on this list, please refer to the complete list of commands.
| chart - Returns results in a table format.
- Example:
...| chart eval(avg(size)/max(delay)) AS ratio BY host userreturns the ratio of averagesizefield to the maximum "delay" for each host and user.
| dedup - Removes events that contain a duplicate combination of values for the fields that you specify.
- Example:
... | dedup source sortby -_sizeremoves duplicate results with the same "source" value and sorts the results in descending order by the "_size."
| diff - Returns the difference between two results.
- Example:
... | diff pos1=1 pos2=3 attribute=ipreturns the "ip" values of the first and third search results.
| eval - Calculates an expression and puts the value into a newly created field.
- Example:
...| eval above_average=if(value>avg(value),"true","false")creates a field called "above_average" and assigns an expression.
| geostats - Generates statistics to display geographic data.
- Example:
... | geostats latfield=eventlat longfield=eventlong avg(rating) by genderreturns the average rating for each gender after grouping the events by "eventlat" and "eventlong" values.
| head - Returns the first 10 events by default.
- Example:
...| head limit=20returns the first 20 results.
| iplocation - Adds the City, Country, latitude, longitude, and Region fields to the results.
- Example:
...| iplocation clientipadds location information.
| rangemap - Categorizes the values in a numeric field.
- Example:
...| rangemap field=magnitude green=3.9-4.2 yellow=4.3-4.6 red=4.7-5.0 default=grayreturns a table with the count between the color field values.
| rare - Returns the least common values in a field, limits to 10 by default.
- Example:
... | rare user by hostreturns the least common values in the "user" field for each "host" value.
| rename - Renames one or more fields.
- Example:
... | rename count AS "Count of Events"rename the "count" field as "Count of Events."
| replace - Replaces field values in your search results with the values that you specify.
- Example:
...| replace "" WITH " " IN errmsgsearch for an error message and replace empty strings with a whitespace.
| sort - Calculates statistics based on fields in your events.
- Example:
... | sort 10 -countreturns 10 results with the highest values in the count field.
| stats - Calculates statistics, such as average, count, and sum, over the results set.
- Example:
...| stats avg(*lay) BY date_hourreturns the average, for each hour, of any field that ends with the string "lay."
| table - Returns a table that is formed by only the fields that you specify.
- Example:
...| table clientip, networkreturns a table based on "clientip" and "network."
| timechart - Returns results in a table format based on time.
- Example:
...| timechart eval(avg(size)/max(delay)) AS ratio BY host userreturns the ratio of averagesizefield to the maximum "delay" for each host and user based on time.
| top - Returns the most common values of the field, limits to 10 by default.
- Example:
...| top IP_Address limit=20returns the top 20 most common IP_Address values.
| tstats - Searches on index-time fields instead of raw events, faster than the stats command.
- Example:
|tstats count where index* by index, source, sourcetypereturns a list of each source, sourcetype, and index based on the indexes you have access to.
| where - Uses eval-expressions to filter search results, only displays true values.
- Example:
... | where ipaddress=clientipreturns events where the field "ipaddress" is equal to the field "clientip".
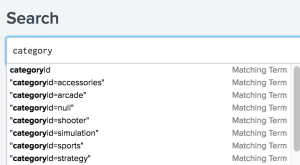
Search Assistant
Since Splunk contains so much data, there is a search assistant that will appear as you type your search criteria. It returns matching searches, which are based on the searches that you have recently ran. The matching searches list is useful when you want to run the same search from yesterday, or a week ago.
Fields
When you are unfamiliar with the logs you need, it is recommended to rely heavily on fields. As you become more familiar with your logs, you will learn the log syntax and be able to specify the necessary fields more easily.
When you run a search, the fields are identified and listed in the Fields sidebar next to your search results. You will see default fields and interesting fields. Interesting fields are other fields that have been extracted from the events in your search results. As you add fields to your search, your results will become more specific.
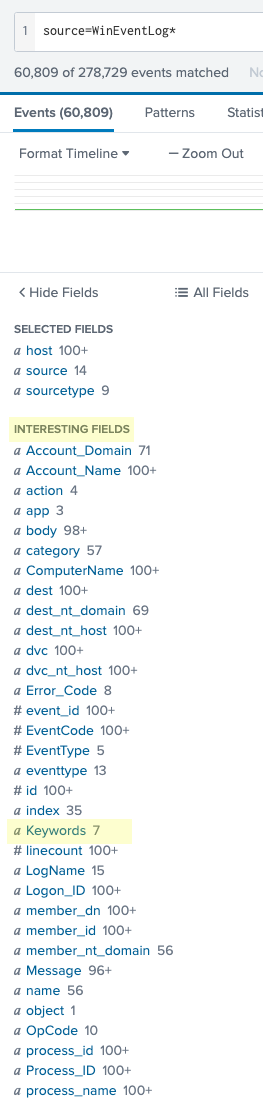
You can select each field to view the top values to get an idea of the values included in the data.
For example, from the above screenshots, you want to view the installation progress for Windows Event Logs. You can do a generic search for:
source=WinEventLog*
then look through the different field values. The field "Keywords" show values related to the installation progress. The search then becomes:
source=WinEventLog* Keywords="Installation, Started" OR Keywords="Installation, Success" OR Keywords="Installation, Failure"
which will return all WinEventLog events that contain the specified values for the "Keywords" field.
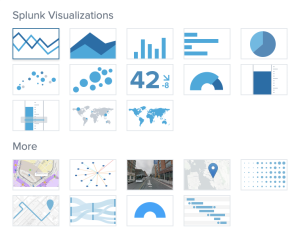
Visualizations
We can turn events into easily understandable visualizations such as tables, charts, a single value, gauges or maps. Charts can be viewed as pie, column, bar, line, area, scatter, or bubble.
- Determine what search you want to see.
- Below the Search bar, select Visualization.
Select the desired visualization.
- (Optional) Use the "Format" menu to configure the visualization.
- (Optional) Create a Dashboard or Report.
Examples
|tstats count where index=* by index, source, sourcetypeTable the different sources, their sourcetypes, and their indexes that you have access to.|tstats count where sourcetype=*nix* by index, source, sourcetypeTable the different sourcetypes that contain "nix" by their source and index that you have access to.|tstats count where source=* by index, source, hostTable the different hosts and their sources for each index that you have access to.index="xenopsychology" error | eval log_type="error"Look in xenopsychology data for the word "error" then create a new field called "log_type" and assign the value of "error."index=xenopsychology sourcetype=criticalsystem Status="Error Message:*"Searches criticalsystem for a field that contains "Error Message:."index=xenopsychology sourcetype=criticalsystem "Status: Error Message:"Searches criticalsystem logs for the string "Status: Error Message:."index = _internal | chart avg(bytes) over sourcetypeDisplays the average size each sourcetype produces.index = _internal | stats count by action, host | dedup actionReturns how many times an action occurs for each host.source=WinEventLog* Keywords="Installation, Started" OR Keywords="Installation, Success" OR Keywords="Installation, Failure"Returns all WinEventLog events that contain the specified values for the "Keywords" field.- Is there a difference between “IP=0.0.0.0" and IP=0.0.0.0 or IP=”0.0.0.0”? Yes!
“IP=0.0.0.0"returns all events that explicitly state “IP=0.0.0.0" so if you know a log explicitly states a string you are looking for, wrap it in quotations.IP=0.0.0.0andIP=”0.0.0.0”returns all IP events that have the value 0.0.0.0. These small differences can make it easier for Splunk to search for the string instead of checking to make sure the field exists and then searching through all the values for that field.
For in-depth examples and explanations, please see Searching Examples.