Learning the Splunk language will take practice, but following the Recommendations, there's a process you can follow:
- Identify your goal.
- Narrow the timeframe.
- Pick out the needed data. (Run:
|tstats count where index=* by index, source, sourcetype.) - Investigate the data to identify other values that will assist in achieving the goal.
- Make the data easy to draw conclusions using naming, statistical analysis, and visuals.
Splunk has created a collection of uses cases and common searches for information security, financials, health care, and IT.
Highest Log Volume
You just heard about new vulnerability that if exploited, will increase traffic on Linux systems. You need to quickly verify the Linux security logs are producing their normal amount of traffic.
Let's say you're not sure what the sourcetype would explicitly be called, but you know Linux should be in there, you can run the following to see all sources that contain "linux."
|tstats count where sourcetype=*linux* by index, sourcetypeStart a new search with the sourcetype you identified. Use a small timeframe window. Note: It will take more time and CPU space for a larger time-range.
Narrow down the search to identify the top log producers.
sourcetype=[redacted]| top host| rename count as "Total Logs", percent as "Percent of Log Volume"
Windows Update Status
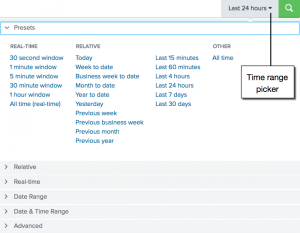
You pushed out a Windows update in the past 24 hours. However, you believe more hosts have updated than your Windows monitoring console shows. You want to see what percentage of hosts have updated and failed.
Let's say you're not sure what the source would explicitly be called, but you know Windows should be in there, you can run the following to see all sources that contain "Win."
|tstats count where sourcetype=Win* by index, source, sourcetypeAfter looking through the different sourcetypes, you see
sourcetype=WinEventLog*includes all Windows Event Logs. You know you want something that mentions "Installation," "Success," and "Failure." By searchingsource=WinEventLog*for a very short timeframe (i.e. 5 minutes), you can see all the associated fields.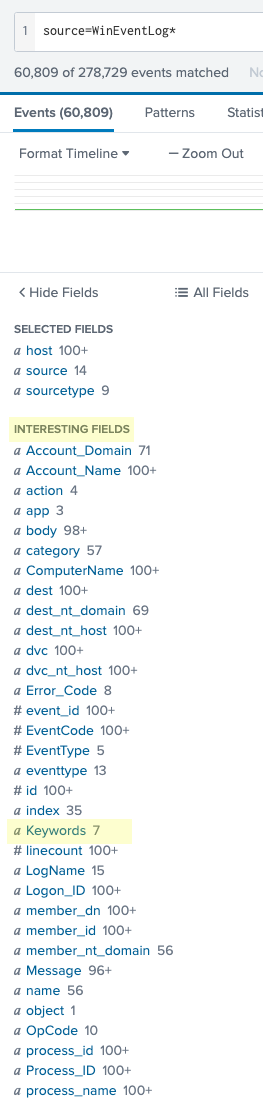
After looking through the interesting fields, it looks like the
Keywordsfield could be the best fit for the search.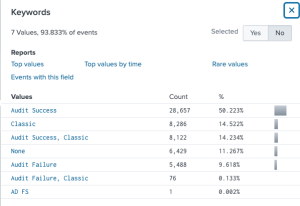
Since the top values do not indicate the specific syntax of the installation information, look up:
source=WinEventLog* | dedup Keywords| table KeywordsDedup Keywords gets rid of any duplicate values associated with the Keywords field. Table Keywords will show all values of the Keywords field.
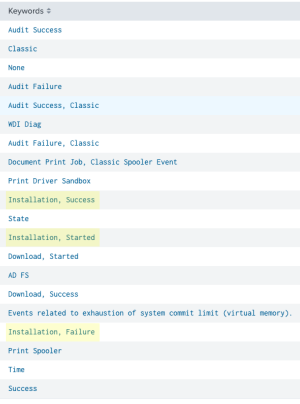
Installation, Started,Installation, Success, andInstallation, Failurewill be included in the search.Create a chart for only the installation fields. The boolean operator OR is included in this search because we want every time at least one of these values were processed.
source=WinEventLog* Keywords="Installation, Started" OR Keywords="Installation, Success" OR Keywords="Installation, Failure"| chart count by KeywordsRename the fields "Keywords" as "Status" and "count" as "Number of Installations."
source=WinEventLog* Keywords="Installation, Started" OR Keywords="Installation, Success" OR Keywords="Installation, Failure"| chart count by Keywords| rename "Keywords" as "Status" | rename "count" as "Number of Installations"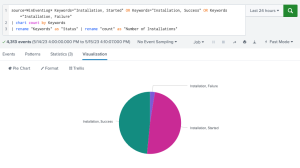
Office365 - Data
You've been tasked with monitoring Office365 uploads and downloads for your unit.
You're not sure what the source would explicitly be called, but you know Office 365 should be in there, you can run the following to see all sourcetypes that contain "365."
|tstats count where sourcetype=*365* by index, source, sourcetypeStart a new search with the sourcetype you identified. Use a small timeframe window.
sourcetype=[redacted]Click through the available fields for one that shows different actions related to uploading or downloading.
Operationis most likely the field.sourcetype=[redacted]| top limit=0 Operation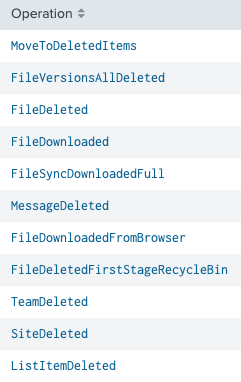
Looking through the different fields of the
Operationfield,FileUploading,FileDownloaded,FileSyncDownloadedFull, andFileSyncUploadedFullshould be the selected fields.sourcetype=[redacted] Operation=FileSync* OR Operation=FileUploaded OR Operation=FileDownloadedClick through the available fields for one that shows the Office365 apps.
Workloadis most likely the field.sourcetype=[redacted] Operation=FileSync* OR Operation=FileUploaded OR Operation=FileDownloaded Workload=*To put the data in an easy to understand format, rename the fields and put them in a chart by the uploads and downloads.
sourcetype=[redacted] Operation=FileSync* OR Operation=FileUploaded OR Operation=FileDownloaded Workload=*| rename FileSyncUploadedFull AS "Sync Upload" FileSyncDownloadedFull AS "Sync Download" FileUploaded AS "Manual Upload" FileDownloaded AS "Manual Download"| timechart dc(user) by Operation