Tableau’s order of operations determines the order in which Tableau executes different commands and filters, which can have a huge impact on the visualization. It is important to understand the order of operations to ensure your visualization, and results, are correct and working as expected.
For Tableau to run in the intended way, you might need to change how you execute certain commands. For example, if you want a dimension filter to take place before a fixed LOD, you could change it to a context filter.
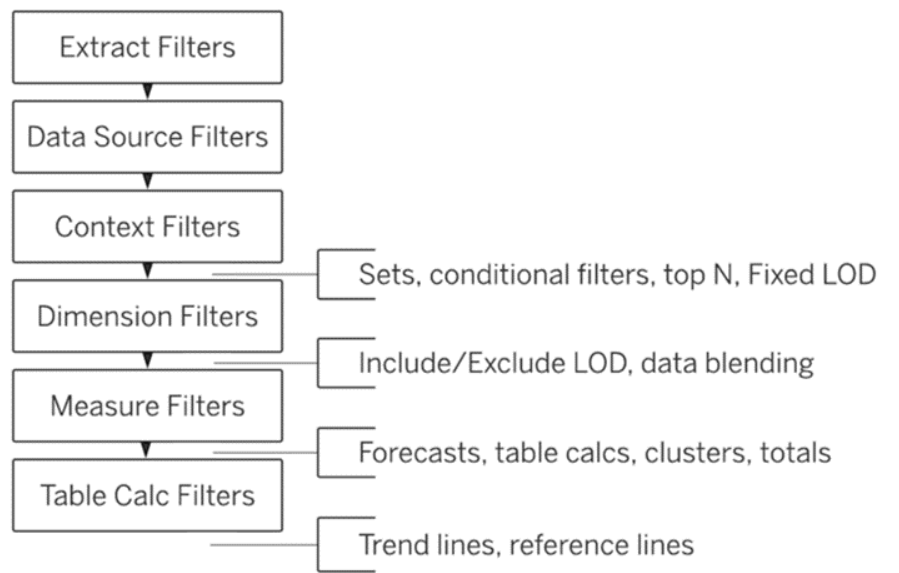
Tableau’s order of operations
- Extract Filters
- Data Sources Filters
- Both extract & data source filters limit the data before it enters Tableau. It is useful to use these filters when you have certain fields you know will not be needed in your analysis.
- Context Filters, which determine which subset of data will be used in other filters and calculations. When you change a filter to a context filter, the other filters in the view then become dependent on that filter, meaning they will only filter the data that has already been filtered by the context filter.
- Context filters are helpful when working with millions of records. For more information on how to apply them properly, visit the Tableau website.
- Sets, conditional filters, top N, and fixed LOD are conditional filters that allow you to filter data based on a condition or a set of conditions. Fixed level of detail expressions compute a value using the specified dimensions, without reference to the dimensions in the view. This means that they calculate a value at the data source level, which remains constant regardless of the filters (except filters that come before it in the order of operations) or other dimensions that are applied in the visualization.
- Dimension filters, which are regular filters that filter categorical data.
- Include/Exclude LOD and data blending.
- Include level of detail calculations tell Tableau which fields to include in the level of detail.
- Exclude level of detail calculations tell Tableau which fields to exclude in the level of detail.
- Data blending is where data from a secondary source is aggregated and then blended with the primary source.
- Measure filters, which influence continuous/numeric fields.
- Forecasts, table calculations, clusters, and totals.
- Forecasts allow you to predict future values based on historical data.
- Table calculations are a special kind of calculated field that computes on what is currently in the visualization, and do not consider anything that is filtered out.
- Clusters are a way to group similar data points in the view using the k-means algorithm, which is an unsupervised machine learning algorithm.
- Totals are aggregate values that provide a summary of your data.
- Table calculation filters are based on table calculations and do not filter the underlying data, instead they just modify the view.
Trend lines and reference lines
- Trend lines are used to show the general direction of the data over time or categories.
- Reference lines are used to mark specific values, regions, or ranges on a continuous axis.