Splunk can be accessed through the following link: Splunk Login.
Supported Browsers
Splunk supports the following browsers:
- Firefox
- Google Chrome
- Safari
- Microsoft Edge
User Interface
When you first login to Splunk, you should see the following:
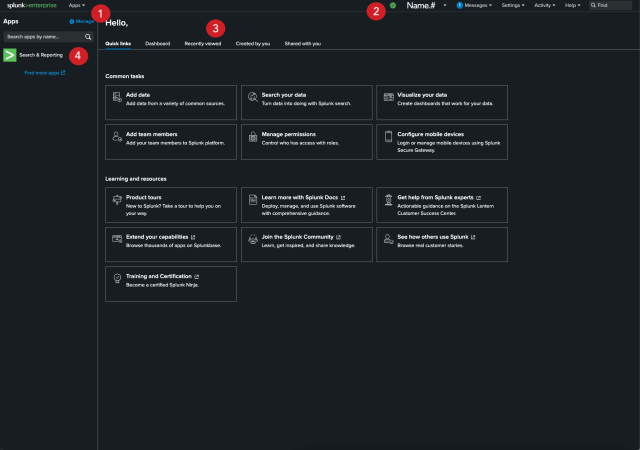
- Apps Menu: Switch between the different apps you have access to. Apps contain saved resources like alerts, saved searches, and dashboards that are grouped by units or purpose. You should see apps related to the unit that you are a part of. If this list is missing apps you think you should have access to, either talk to your supervisor or contact otdi-logsupport@osu.edu to fix this issue.
- Splunk Bar: Edit your Splunk configuration.
- Splunk Panel: Navigate between common tasks, alerts, dashboards, datasets, and reports that you have created, recently viewed, or shared with you.
- Apps Panel: View the different Splunk apps you have access to.
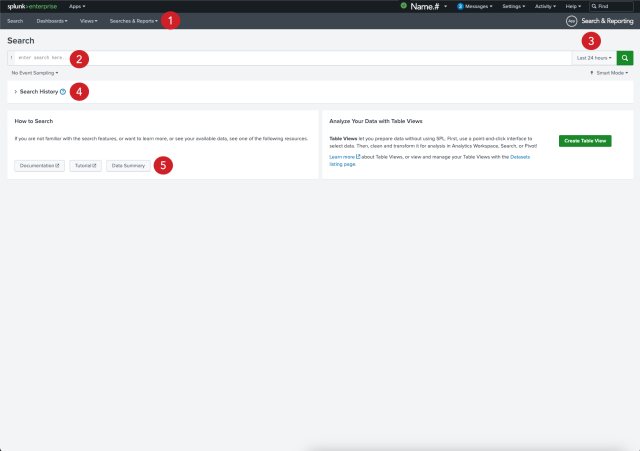
- App Bar: Navigate between the different views in the application you are in. For the Search & Reporting app the views are: Search, Analytics, Datasets, Reports, Alerts, and Dashboards.
- Search Bar: Specify your what you are looking for.
- Time Range Picker: Specify the time period for the search, such as the last 30 minutes or yesterday. For the best results, the time range should be a short period of time.
- Search History: View a list of your previous searches.
- Data Summary: List the hosts, sources, and sourcetypes you have access to.
Searching
After performing a search, you should see the following:
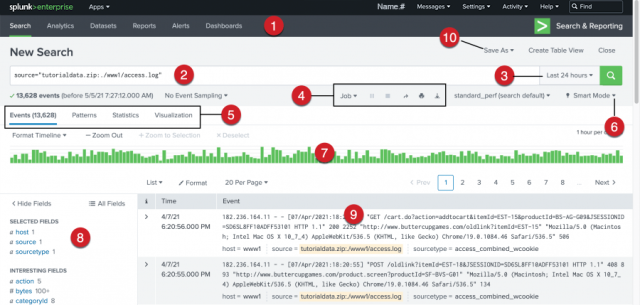
- Apps Bar: Navigate between the different views in the application you are in. For the Search & Reporting app the views are: Search, Analytics, Datasets, Reports, Alerts, and Dashboards.
- Search Bar: Specify your what you are looking for.
- Time Range Picker: Specify the time period for the search, such as the last 30 minutes or yesterday.
- Search action buttons: Actions that you can perform, including working with your search Job, sharing, printing, and exporting your search results.
- Search results tabs: The tab that your search results appear on depends on your search. Some searches produce a set of events, which appear on the Events tab. Other searches transform the data in events to produce search results, which appear in the Patterns, Statistics, and Visualizations.
- Search mode menu: The search mode menu shows the depth of events. Fast mode has the least log depth, Verbose contains the most log depth, and Smart (default) mode contains a medium amount of log depth. Smart mode is the most common mode.
- Timeline: A visual representation of the number of events that occur at each point in time. Peaks or valleys in the timeline can indicate spikes in activity or server downtime. You can format the timescale, zoom out, or zoom to a selected set of events.
- Fields sidebar: Fields display the most common attributes in logs. By default, Selected Fields only contain host, source, and sourcetype. Interesting Fields contain common parameters you can add to the search. Fields are a great way to narrow down your search when you're unfamiliar with the logs.
- Events Viewer: Displays the events that match your search. By default, the most recent event is listed first. In each event, the matching search terms are highlighted.
- Save As Menu: Use the "Save As" menu to save your search results as a Report, Dashboard Panel, Alert, or Event Type.