Splunk alerts are actions that get triggered when specific search conditions are met. Some common alerts include when data fails to ingest, abnormal spikes or declines in traffic, and detecting incidents.
Access to Alerting
By default, alerting is not given with Splunk access. If you are interested in alerting access, please reach out to otdi-logsupport@osu.edu for the alerting you would like to do.
Alerts are based on permissions. They are broken up into the three categories:
- Owner: Makes the alert private to the alert creator.
- App: Displays the alert for all users of the app.
- All Apps: Displays the alert for all users of this splunk deployment.
Creating an Alert
- Determine what search you want to track.
- Run the search and modify any output.
Select Save As > Alert.
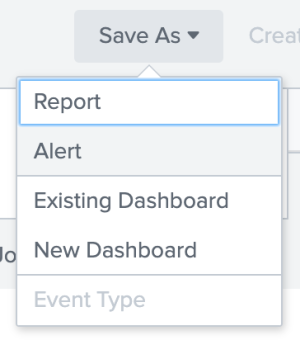
Enter the following criteria:
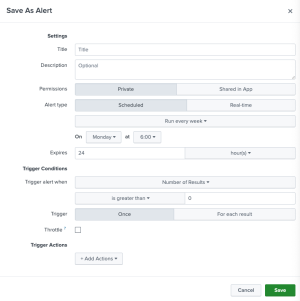
- Title: Name of alert.
- Description: Details about the alert.
- Permissions: Who should access the alert. Private makes the alert only available to you. Shared in App will make it available for everyone in the App.
- Alert type: The frequency you want the alert to run. It is recommended to run Scheduled alerts.
- Expiration: The lifespan of the trigger or how long you can access the result.
- Trigger Conditions: Once the search criteria is met, this is the action to run. The most common actions are to run a script or send an email. One or more alert actions that should happen when the alert triggers.
- Click Save.
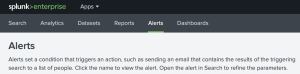
Edit Alerts
- Open the App the Alert is associated with. If the alert is not shared with anyone else or is open to the indexer, go to your Homepage.
Select Alerts.
Select Edit Alert, Change Permissions, etc.
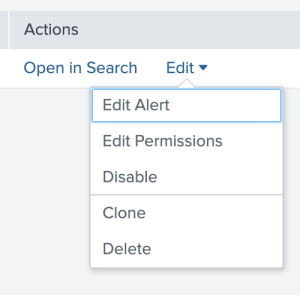
Edit Alert:
- Title: Name of alert.
- Description: Details about the alert.
- Permissions: Who should access the alert. Private makes the alert only available to you. Shared in App will make it available for everyone in the App.
- Alert type: The frequency you want the alert to run. It is recommended to run Scheduled alerts.
- Expiration: The lifespan of the trigger or how long you can access the result.
- Trigger Conditions: Once the search criteria is met, this is the action to run. The most common actions are to run a script or send an email. One or more alert actions that should happen when the alert triggers.
- Edit Permissions:
- Change ownership, share with an App, or all Apps.
- Edit as needed.
- Run the edited search.
- Click "Save."
Critical Log Alert
A common alert departments request is being notified when certain logs are failing to come in. These are usually the most critical logs. Due to time and resources, it is not recommended to alert whenever a data source is failing to report to Splunk. However, if you see a host is failing to report into Splunk, please investigate the source then see Splunk Troubleshooting. There are multiple ways to write the alert, but here is an example:
- Receive alerting permission from otdi-logsupport@osu.edu.
- Determine what sources or sourcetypes are the most critical.
|tstats count where index=* by index, source, sourcetype - Setup your search. Time range: Last 60 minutes.
index=[redacted] sourcetype=[redacted] earliest=-90m latest=-30mearliest=-90mandlatest=-30mmeans Splunk is looking for an event between the last 90 minutes and last 30 minutes.
- Save As > Alert.
- Select a Scheduled Alert.
- Enter the desired time to run the alert and how often.
- Trigger alert when "Number of Results" is less than 20.
- When triggered, send an email to the team with details about the event, include a link to the alert.
Note: This is only an example alert, the timeframes are determinate on your unit's infrastructure, security policies, and goals.
If you receive an alert stating a host has not reported in, please investigate the source then follow Splunk Troubleshooting.