Dashboards provide university managers with quick access to reporting data and data visualization.
Accessing Dashboards
- Log into BuckeyeLearn.
Open Dashboards.
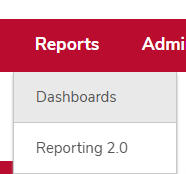
- Hover over the Reports menu item.
- Click Dashboards.
Refreshing Dashboards
You must manually refresh dashboards to see the most updated data.
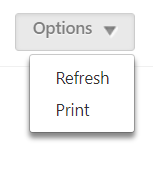
- Click the Options menu.
- Click Refresh.
Viewing Details of a Dashboard Widget
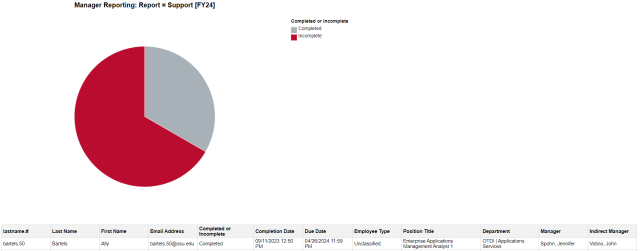
You can view the details of a dashboard widget to see a breakdown of the data included in the pie chart.

- Hover over the Dashboard widget.
- Click the dropdown arrow.
Click View Details. A new window will open to show details of your subordinates’ training progress.
Exporting to Excel
You can export the data to Excel to view the full report output.
- Hover over the Dashboard widget.
- Click the dropdown arrow.
- Click Export to Excel. The report will be downloaded.